Let's do a basic traceroute:
>>> mytrace,err = traceroute (["www.google.com"])
And the classic output is this:
>>> mytrace.show()
216.239.51.99:tcp80
1 192.168.1.1 11
2 87.219.30.1 11
3 10.255.136.254 11
4 10.255.228.1 11
5 10.255.228.2 11
6 208.175.154.177 11
7 195.2.10.122 11
8 195.2.10.129 11
9 195.66.226.125 11
10 72.14.238.253 11
11 66.249.95.146 11
12 216.239.49.34 11
13 66.249.94.235 11
14 72.14.238.232 11
15 72.14.238.97 11
16 66.249.95.149 11
17 72.14.239.17 11
21 216.239.51.99 SA
23 216.239.51.99 SA
24 216.239.51.99 SA
26 216.239.51.99 SA
29 216.239.51.99 SA
Now if we want to create a 2D image of the results we just do this:
>>> mytrace.graph(target=">mytrace.svg")

Better for understanding ;)
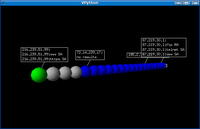
And for last the 3D output:
>>> mytrace.trace3D()

Cool! if you right click on any host, scapy will scan for port 80,22,21,23,25 and 443.
I think it's more useful the 2D output, but the 3D is so cool...
You can download scapy, from http://www.secdev.org

0 comentarios:
Post a Comment